Snow in October
The weather in the Finger Lakes can vary greatly in October. As autumn storm systems barrel through, the region can experience both very warm and very cold temperatures within a span of a day or two.
Sometimes, particularly in the second half of the month, snow enters back into the weather forecast as the waves of cold intensify.
Typically, these early season snow events are highly dependent on location. Elevation has a very large role to play in early season snow, as does lake effect precipitation off the Great Lakes.
October snow does not usually stick around, but for some areas, it is much more common than others.
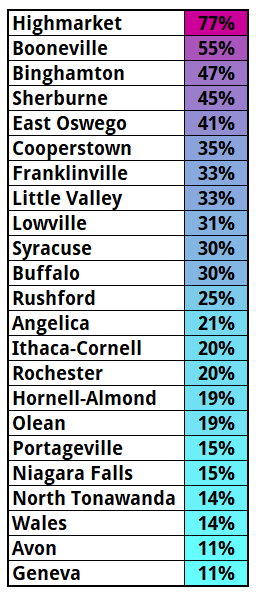
In the map above, I have attempted to identify the areas most likely to see snow in October and quantify just how common it is.
Areas in the darker blue shading typically see accumulating snow in October every two or three years. The lighter shading of blue has snow about every three to five years, while cyan areas typically go five or more years between October snow events. This map does not account for non-accumulating snow.
Of course, the weather does what it will and does not follow hard and fast rules like those. As I went through the records, there were multiple cases where it either snowed, or did not snow, many Octobers in a row.
As a general rule of thumb though, higher elevations and those more prone to lake effect are going to see snow much more than lower elevations in unfavorable lake effect areas.
This map is meant as a general approximation. Undoubtedly, it is not 100% accurate for everywhere. This was more of a quick back-of-the-envelope exercise rather than a hard-core scientific study.
Read on for more information on my methodology and some of the challenges I encountered.

Map Methodology
The first step I took in producing this map was to look at snowfall data for the last thirty years over the Finger Lakes and surrounding regions.
Unfortunately, the data were sparse, which made for significant gaps in my map. Within the heart of the Finger Lakes, substantial data only existed for Geneva, Ithaca, Rochester, Syracuse, Binghamton, and Avon. A much greater concentration of data exists for the western Southern Tier with some additional sparse data in Central New York and the Tug Hill region.
In all, I used snow data from 23 official observation and coop weather sites. I counted the number of years between 1988 and 2017 that had snow in October and divided that by the number of years in which data was present. All sites had data from at least 22 of the 30 years and most had over 25 years of data. This division gave me the percent of Octobers that had snow.
I plotted these percentages on the map and did a first pass at grouping the data points together. However, with large spatial gaps between data points, I needed more information.
I took my initial map and overlaid elevation. I then adjusted my lines based on the elevation and my experience with where lake effect was more prevalent. I had to estimate the impacts of elevation in many areas, especially in the western Southern Tier, where many of the data points I had were at lower elevations.
In the end, after some final adjustments, I was able to produce a map that seems like a reasonable approximation of how frequently snow occurs in October. It is not exact, but drives home once again the many different microclimates of our region that make weather forecasting a unique challenge.
Subscribe to the Blog!
Get posts like this and the latest no-hype local weather information delivered directly to your inbox! Signing up is free, easy, and secure.
[jetpack_subscription_form title=”” subscribe_text=”Enter your email here!” subscribe_button=”Sign Up” show_subscribers_total=”1″]
